Chrome DevTools Console Drawer
Have you ever accidentally hit the escape key while using the Chrome DevTools? And that little bottom drawer pops up with another console. And you're like, what the heck is this thing?
If so, then you've encountered the "Console Drawer." But, what exactly is it? And what secrets does it hold!? Here is a list of 6 things you can do with the Console Drawer.
1. View unused CSS & JS
You can open the Coverage panel inside the Console drawer and generate a code coverage report for your website! This is super helpful if you want to catch any unused CSS that might be lingering around, bloating your bundle size!
It's worth noting that while identifying unused code for a specific page is easy, it's much more difficult to configure your build not to serve specific CSS or JS per page. So take this with a grain of salt!
2. Monitor CPU and Memory in real-time
Although the DevTools have multiple places to get profiling data, the real-time performance monitor is a great place to start!
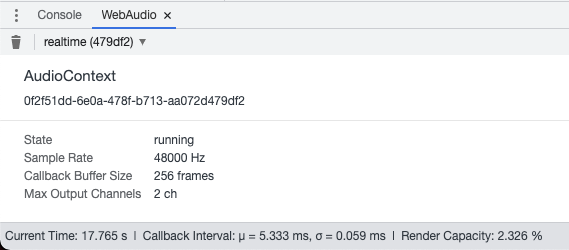
3. Inspect Web Audio
4. Inspect Animations
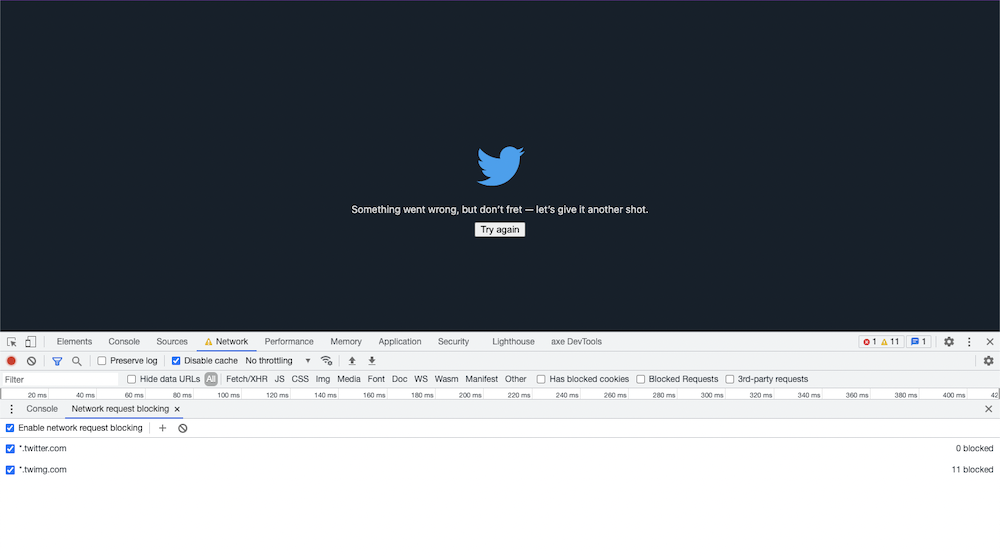
5. Block Network Requests
You can build your own ad blocker! Or test your application... Enter any URL you'd like to block (using * as a wildcard), and Chrome won't load those requests.
Nailed it.
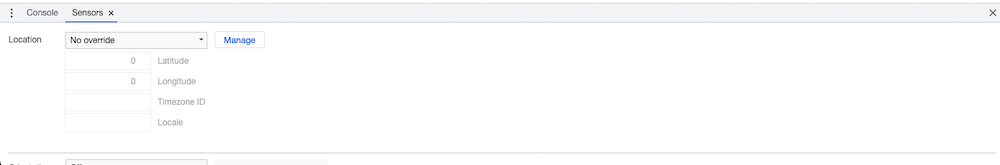
6. Override Location, Touch or Idle State
You can manually set your country of origin. Override your mouse clicks to be touch events or event simulate a mobile device idle state! All from the DevTools!